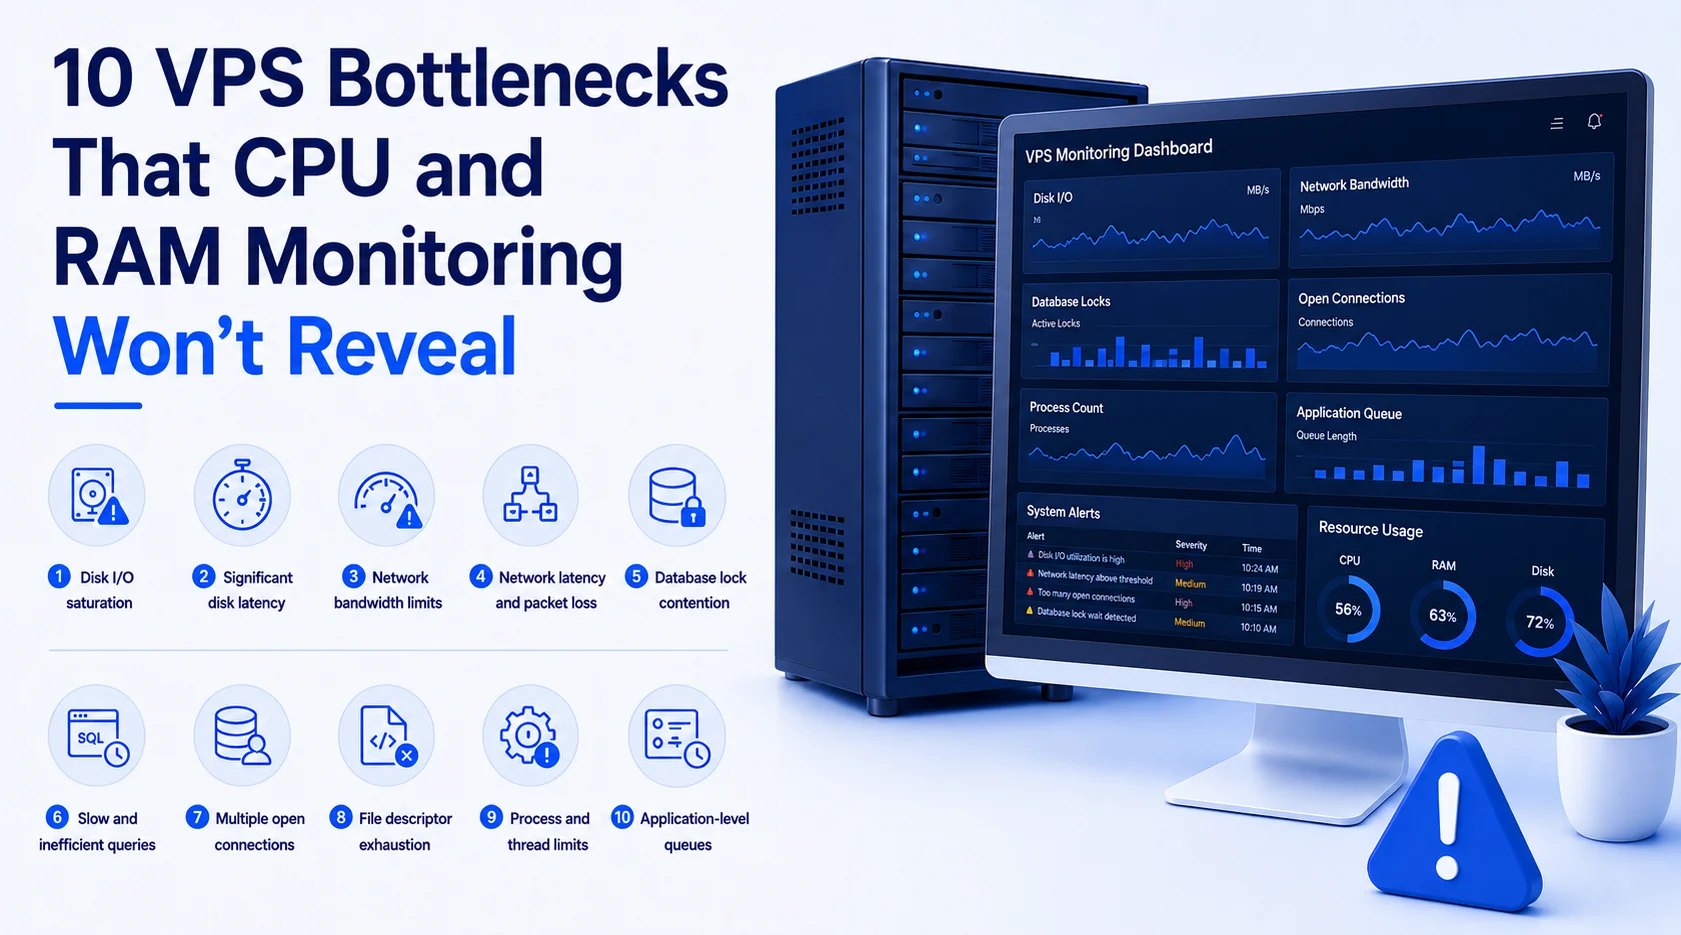
CPU and RAM usage are the first places an admin looks when a VPS starts to slow down. But these metrics are informative and not enough to make a complete diagnosis of your cheap Linux VPS hosting in India. This is because the server’s performance depends on many resources, not just CPU or memory.
Bottlenecks can occur in storage, networking, databases, the application process, or even the system limits. If monitoring is only targeting CPU and RAM, these may go unnoticed. Knowing these not-so-obvious bottlenecks could ease the way of discovering the reasons for your Nextcloud VPS hosting solution.
10 VPS Issues That RAM and CPU Monitoring Misses
1. Disk I/O saturation
A VPS may have plenty of CPU power but still face storage issues. Applications that read or write a lot of data cause a lot of I/O.
Common sources of storage processes include databases, logging systems, backup utilities, and content-rich applications. But when the disk is overloaded, some operations wait until reading or writing is completed.
The situation can seem like an application issue, although both CPU and memory usage are normal. Therefore, monitoring disk throughput, I/O wait, and latency is also essential to understand the physical drive errors.
2. Significant disk latency
While disk throughput matters, latency time is also essential. A server processes a reasonable volume of information. Thus, operations take time, and this delay leads to the situation where applications wait for a long time for the completion of operations.
That is especially evident in the case of databases and applications that perform a large number of small writes and reads. Therefore, it is useful to analyze both storage latency and I/O utilization at the same time.
3. Network bandwidth limits
Monitoring the CPU and memory helps to find out if a VPS experiences high network usage, but it does not provide any other details.
For instance, a website serving big files, a video-hosting platform, a backup service, or other data-intensive platforms demands a lot of network resources. When the network capacity is poorly utilized, users face delays with downloading. Thus, monitoring the throughput and limits of the network is required.
4. Network latency and packet loss
A respectable amount of network bandwidth does not guarantee the quality of network usage.
The user observes problems with high latency and packet loss, routing, and instability of connection that result in delays caused by the long distance data travels from VPS to customers or external services.
These issues are serious where interaction with users happens very often. Hence, network monitoring is necessary to avoid latency. Relying on CPU and RAM monitoring does not provide any hints regarding the situation.
5. Database lock contention
A database may not be functioning properly even when a VPS has enough resources.
Problems can arise when different operations attempt to use or change the same database at the same time. The locks caused in such situations lead to a waiting period for users even though CPUs and memory are not used fully.
When you monitor database lock contention, it includes execution time, active locks, sessions waiting for an operation to finish, etc., giving overall information about the VPS server.
6.Slow and inefficient queries
Some problems are caused by poor queries that simply take too long. For example, when an index is missing, the system has to scan the entire database instead of just searching for the record it needs.
As a result, adding more computing power (RAM and CPU) is not a solution. Query analysis and database optimization most likely help here.
7. Multiple open connections
Every application and server has its restrictions on the maximum possible connections. Under such conditions, if the application tries to establish too many database connections, file connections, and network connections, the VPS starts showing issues.
Connection exhaustion leads to the situation when new connections cannot be established even though CPU and RAM usage are still available.
This could happen for several reasons, such as heavy traffic, incorrect application settings, connection leaks, improperly configured connection pools, etc. Using tools for monitoring connections and limits reveals the problem.
8. File descriptor exhaustion
Every open file/socket/some specific system resources consume one file descriptor.
If the operating system has reached the maximum number of file descriptors, it stops performing further operations, such as opening files or establishing network connections.
Thus, users notice that their application regularly encounters errors or failed requests when the CPU and RAM utilization remain normal.
9. Process and thread limits
The functioning of applications relies on processes and threads. Limits can be set by hosting environments or operating systems on the number of threads or processes.
When an application reaches these limits, new requests experience delays or get rejected even when the server is still capable of processing data. Therefore, not just CPU and RAM monitoring but also knowledge about process count, number of threads, and limits imposed by the OS helps identify the VPS bottlenecks easily.
10. Application-level queues
In some cases, the problem is inside the application rather than in the VPS.
The web application many times adds some tasks in queues waiting to be processed in the background (e.g., sending emails, generating reports, processing images, or fulfilling orders). If the tasks processed by workers don’t catch up with those added to the queue, the queue grows.
CPU and RAM usage may be low on the server, but users have to wait for their tasks to be processed. Making records of the queue length, the workers’ activity, and the queue growth over time can help identify these types of issues.
Final Consideration
A VPS does not need to operate with the CPU at 100% and use all the available RAM to have performance problems. Storage latency, bottlenecks in networks, database locks, inefficient queries, connection issues, system limitations, and waiting application queues can make workloads run slow even when CPU and RAM work at acceptable parameters.
The trick is in the ability of the administrator to follow the request path through the complete system instead of focusing only on the amount of CPU and RAM used. Once all those less obvious bottlenecks are monitored, it will become easier to identify performance problems in VPS.